Friday, September 22, 2006

CIRCULATING VACCINE-DERIVED POLIOVIRUSES (cVDPVs) POLIO

CIRCULATING VACCINE-DERIVED POLIOVIRUSES (cVDPVs) POLIO AND POOR POST VACCINATION WASTE DISPOSAL
(16 September 2006)

INTRODUCTION
The Active Surveillance system for acute flaccid paralysis (AFP) in Madagascar detected cases of paralytic poliomyelitis due to cVDPVs in Toliara Province in south-western Madagascar from 2001 to 2005. (Rapport du Comité National de certification de l’éradication de la poliomyélite Années 2004 et 2005). In 2005 out of six cases of PFA due to cVDPVs in this Province four were from the Region of Atsimo Andrefana in the Health Districts of Toliara I (1 case), Toliara II (2 cases), Sakaraha (1 case).

The review of literature reveals that
  • OPV is genetically unstable; small number of attenuating mutations (vaccine virus still very similar to wild virus) occurs. The mechanism of cVDPVs is believed to be a mutation, or reversion, of the vaccine virus to a more neurotropic form. These mutated viruses are called revertants. Reversion is believed to occur in almost all vaccine recipients.
  • Excreted vaccine-derived viruses often are more virulent than the original OPV strains
  • Risk factors for emergence of cVDPVs are low levels of population immunity against polioviruses.
  • Public health investigations suggest that low vaccination coverage for OPV is allowing cVDPVs to circulate and revert to wild-type characteristics.
  • Mass vaccination campaigns with OPV and high routine vaccination coverage for OPV appear to interrupt the circulation of VDPVs
  • Contributing factors for cases of AFP due to cVDPVs are low vaccine coverage for OPV in the affected communities, and inadequate vaccination of the affected individuals with OPV.
Madagascar has six Administrative Provinces – Antananarivo, Antsiranana, Fianarantsoa, Mahajanga, Toamasina, and Toliara; divided into 22 Administrative and Health Regions. Cases of paralytic poliomyelitis due to cVDPVs have been detected only in the Regions and Health Districts of Toliara Province. During the author’s STOP mission to Madagascar from 24 May to 12 August 2006, he worked in Health Districts in three Regions: Region of Atsimo Andrefana, in Toliara Province, where cases of paralytic poliomyelitis attributed to cVDPVs were detected in three health districts (Toliara I, Toliara II and Sakaraha) in 2005, Region of Haute Matsiatra in the Province of Fianarantsoa, and Region of Boeny in the Province of Mahajanga. An attempt was made to elucidate other factors that may be responsible for to the appearance of the cVDPVs.

GOAL
Present the hypothesis that poor post vaccination waste disposal may be a contributing factor for emergence of circulating vaccine-derived polioviruses (cVDPVs).

SPECIFIC OBJECTIVES
  1. Describe the geographical and physical features of the Health Districts of Toliara I and Toliara II in the Region of Atsimo Andrefana; Fianarantsoa I and Fianarantsoa II in the Region of Haute Matsiatra; and Mahajanga I and Mahajanga II in the Region of Boeny.
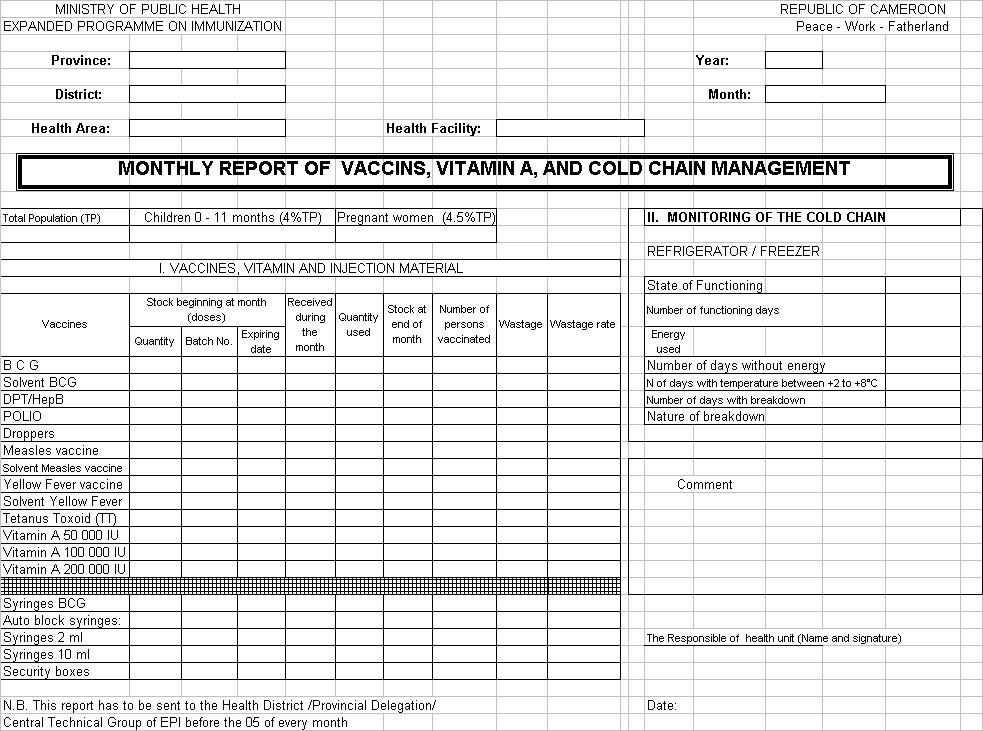
  2. Present the results of injection security investigation.
METHOD
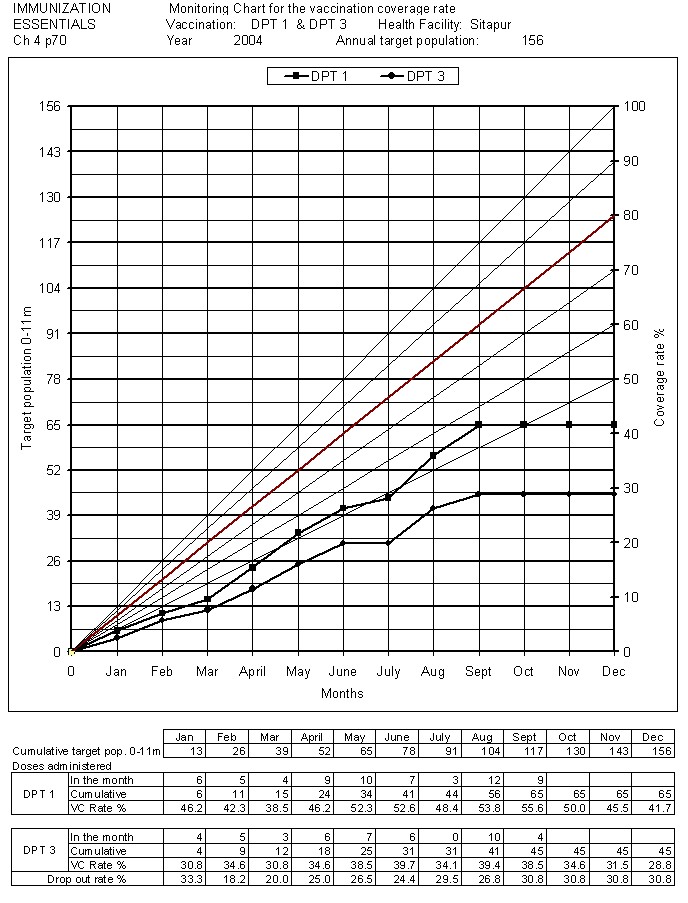
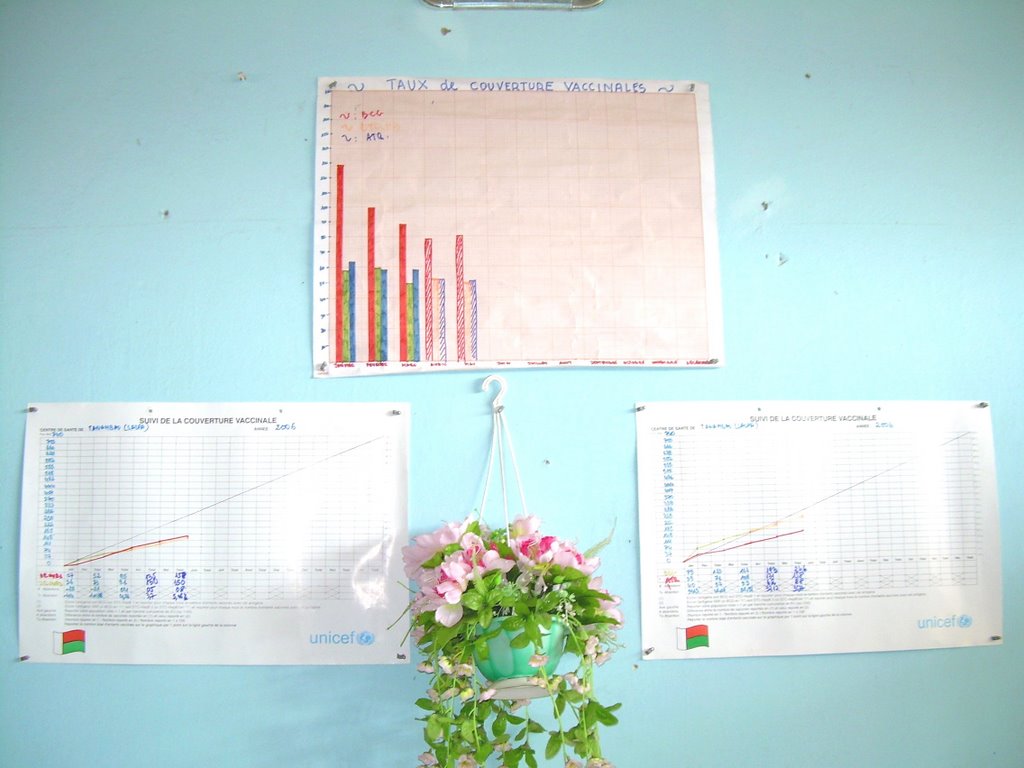
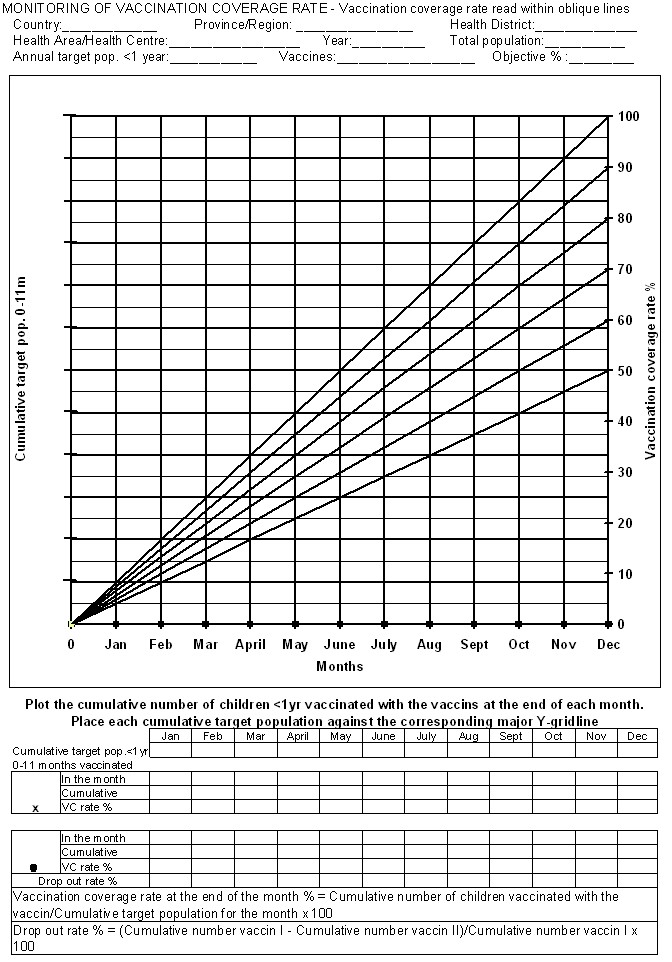
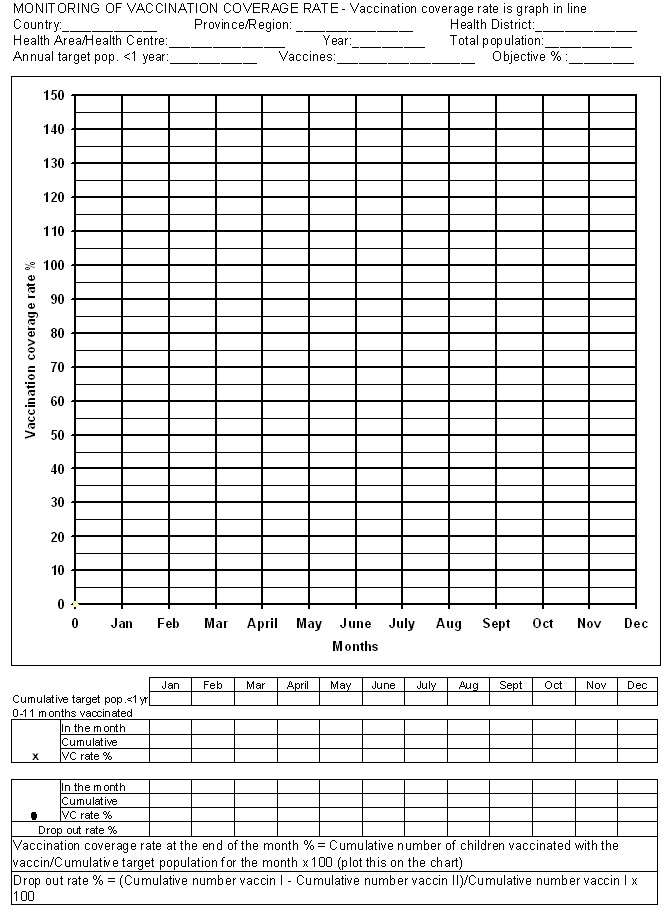
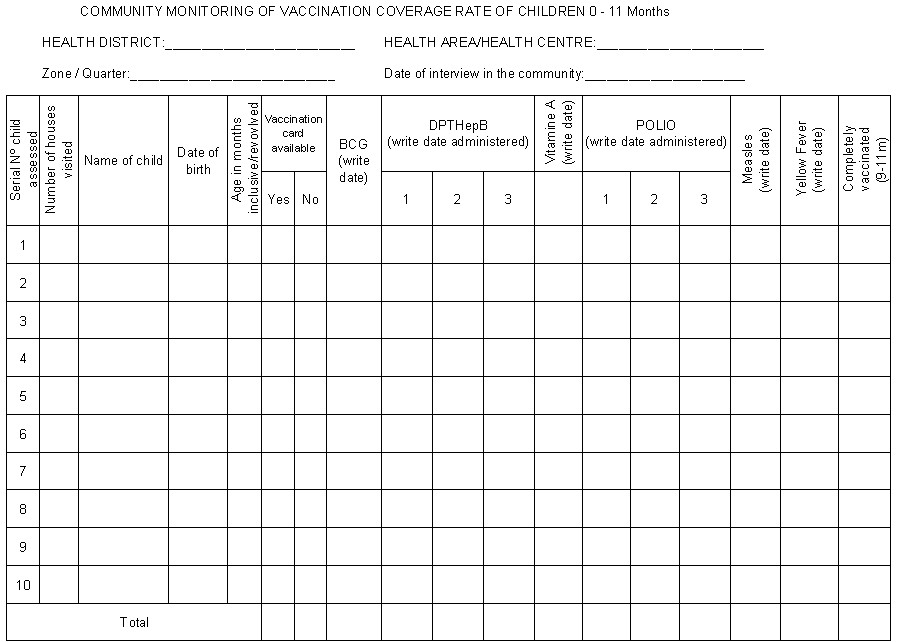
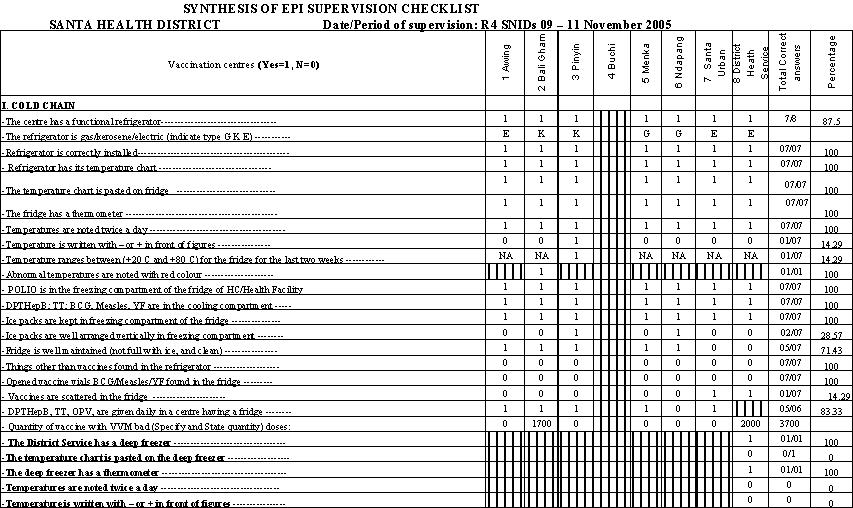
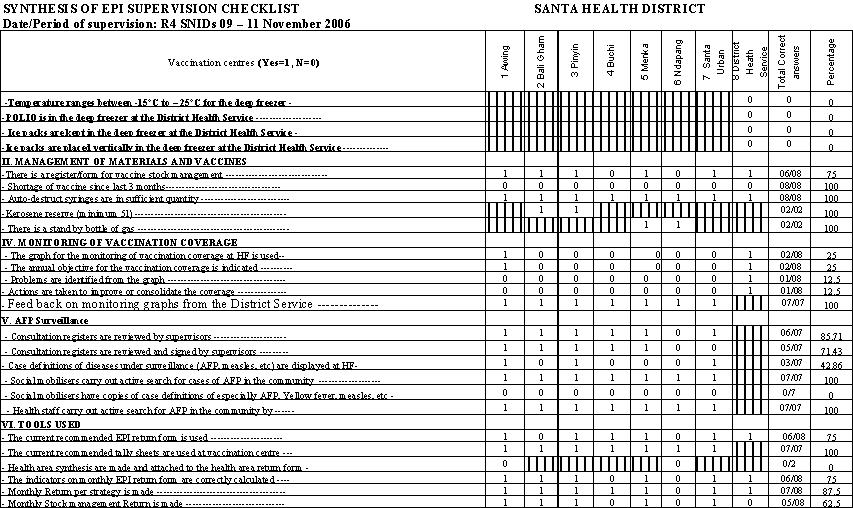
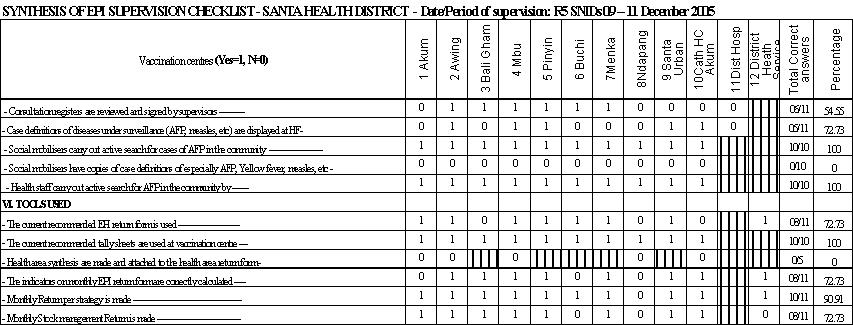
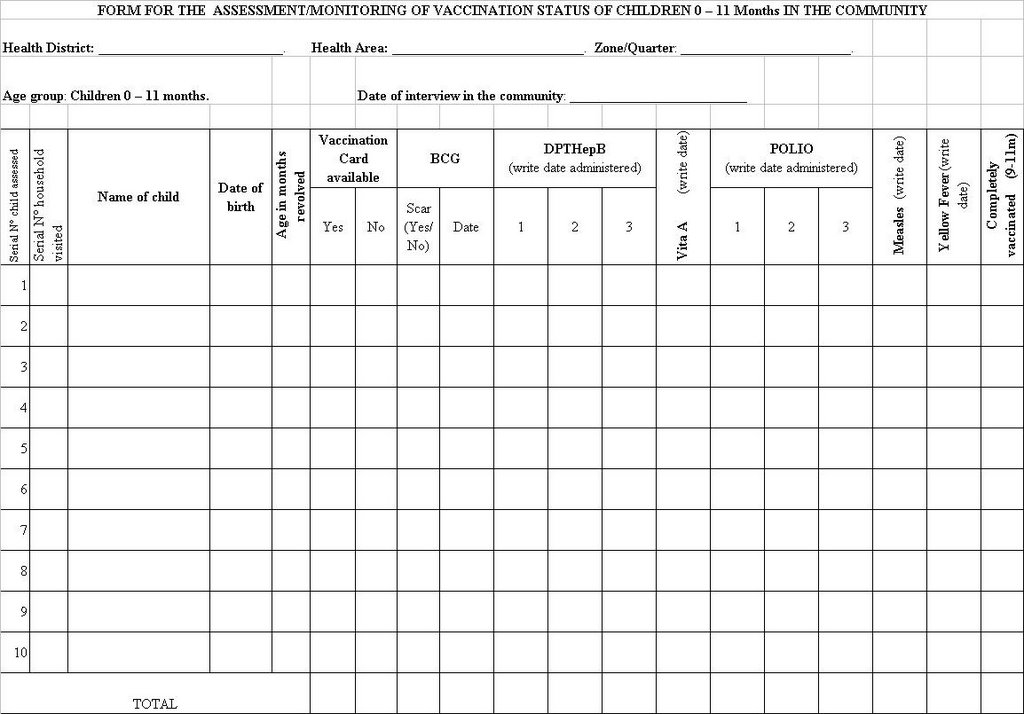
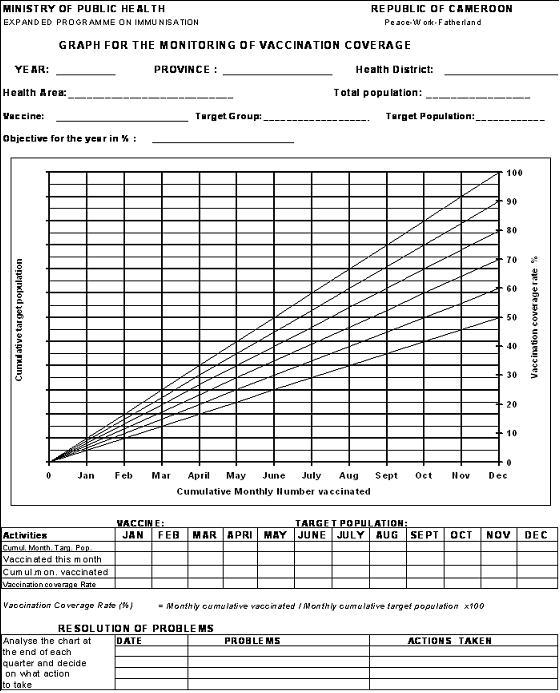
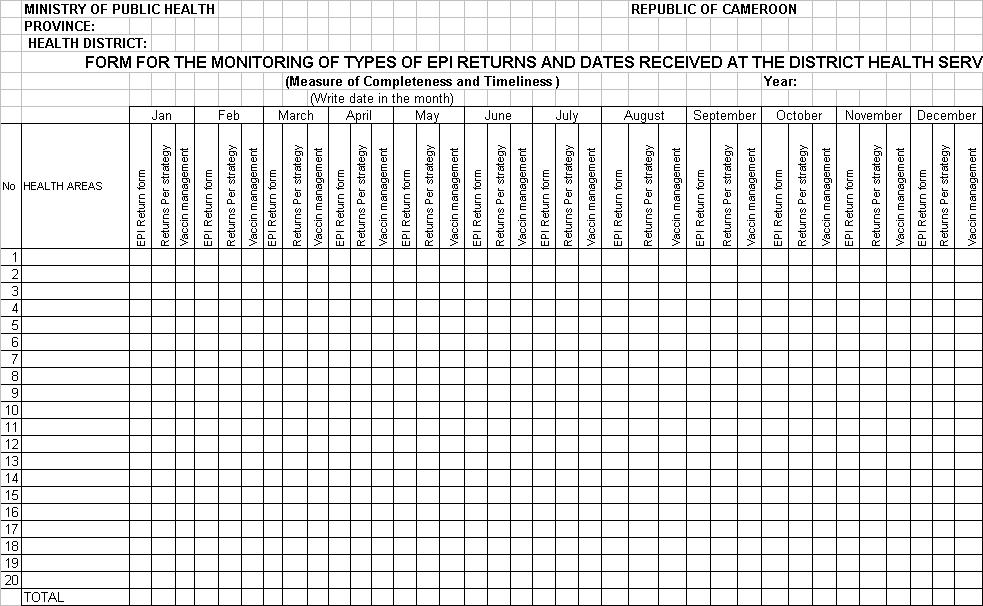
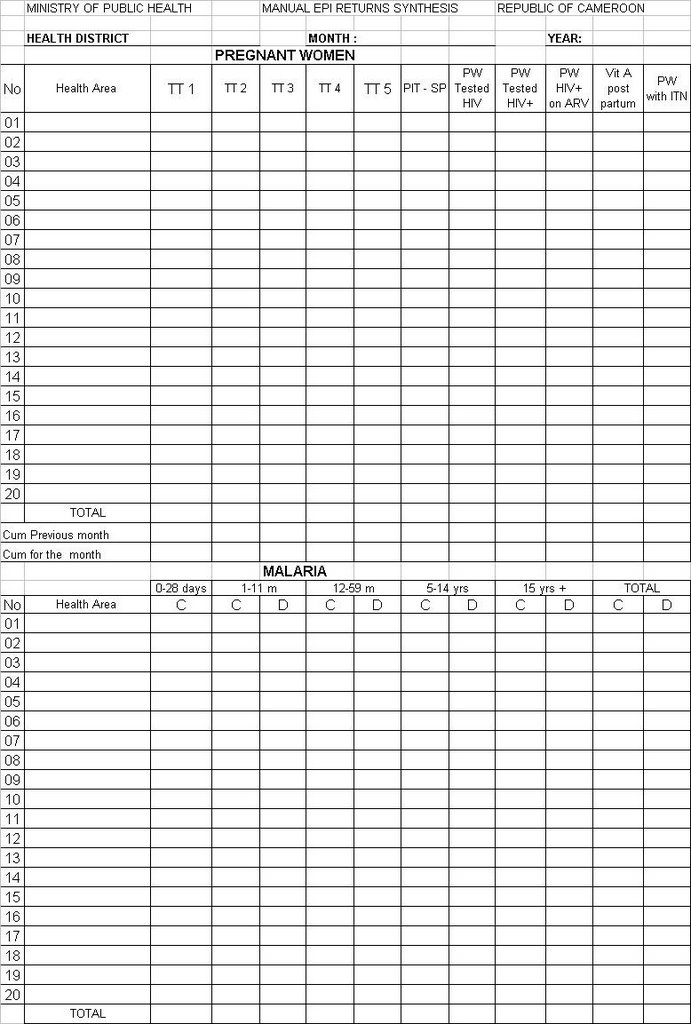
During the STOP Team mission in Madagascar from 24 May to 12 August 2006 the author designed and applied a supervision checklist to assess the process indicators in the implementation of the Expanded Programme on Immunisation (EPI) by health care providers. The components of the supervision checklist were: the cold chain, injection security, monitoring of vaccination coverage rate, supervision and feedback, active disease surveillance, social mobilisation, and community participation.

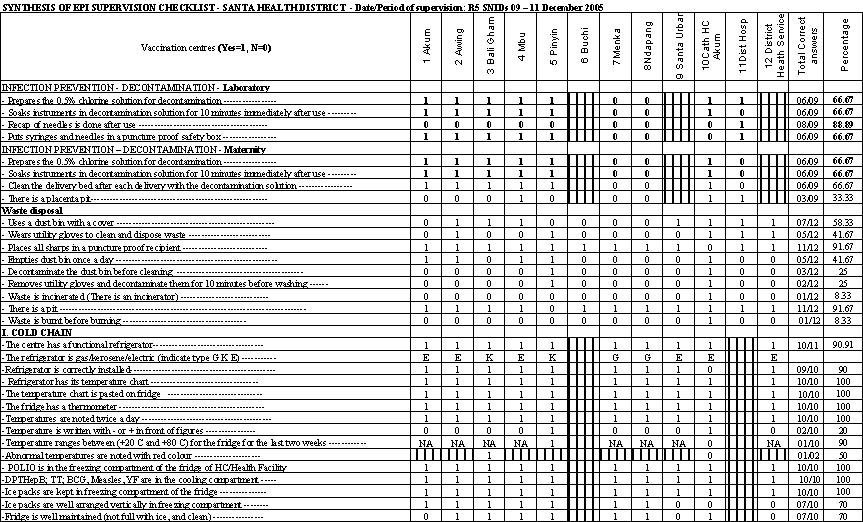
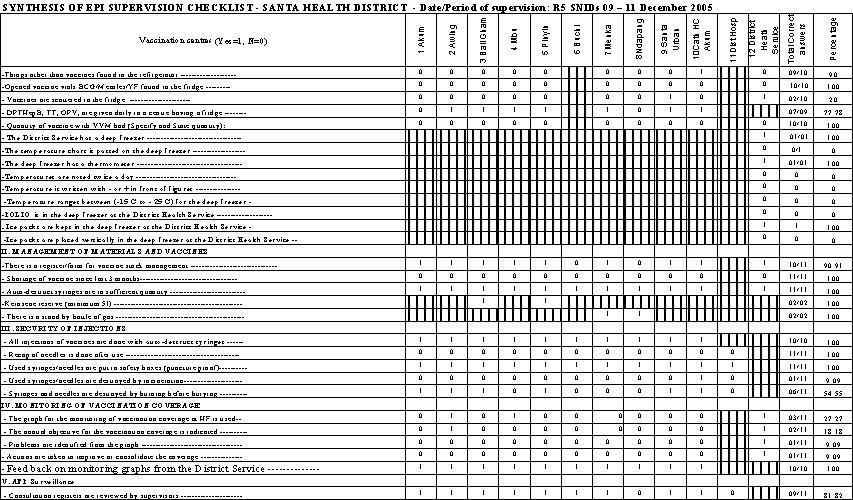
Only injection security will be considered in this report. The following tasks were investigated at the level of health facilities: recapping of needles, the use of safety boxes, and the disposal of syringes, needles and empty vaccine vials.


RESULTS
a) GEOGRAPHICAL AND PHYSICAL FEATURES OF REGIONS:
  • Atsimo Andrefana

    It is situated at the south west of Madagascar and is made of nine Health Districts. Toliara I Health District is the urban section of the city of Toliara, the Capital of Toliara Province and Region of Atsimo Andrefana. Toliara is a seaport. Toliara I Health District is in the flat low coastland. Toliara II Health District is the rural part of Toliara city and beyond. It consists of the flat low coastland and hills. Most the rivers in this narrow coastal plain are seasonal. Sakaraha Health District is hilly with fast flowing streams. The Province of Toliara is considered the most arid part of Madagascar. The low coastland is very sandy, flat and submerged underwater during the rainy season from September to March. Pits for waste disposal at Health Facilities in the low coastland are filled by sand during the rainy season and even in the dry season under the influence of wind.
  • Haute Matsiatra
    It is situated in the central high plateau and mountains with permanent rivers; large valleys used for farming especially rice fields. The rivers are fast flowing. The health facilities and residential areas are situated on hills or slopes with very good drainage in all the five health Districts. The soil is solid and hard; pits for waste disposal remain intact until they are full. It has five Health Districts.
  • Boeny
    It has a narrow coastland with undulated hills on the Northern part of Madagascar. Mahajanga is situated on a hill with a narrow coastland. Mahajanga I is the urban section of the city while Mahajanga II is the rural area and beyond. The soil in Mahajanga is hard. The Region of Boeny has six Health Districts
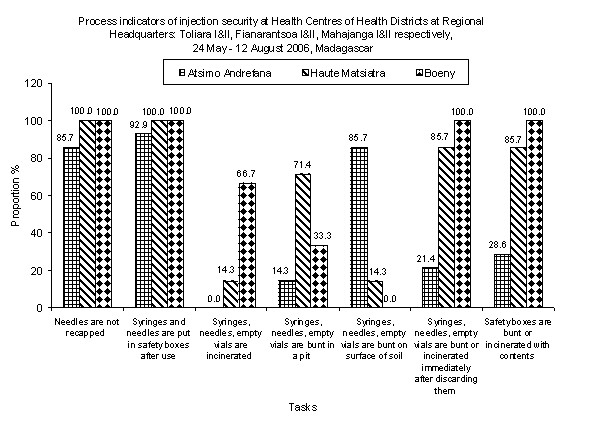
b) INJECTION SECURITY INVESTIGATION
  • Toliara I and Toliara II Health Districts, Atsimo Andrefana Region
    (14 vaccination health centres supervised)

    - Needles are not recapped: 85.7%.
    - Syringes and needles are put in safety boxes after use: 92.9%.
    - Syringes, needles, empty vials are incinerated: 0.0%.
    - Syringes, needles, empty vials are bunt in a pit: 14.3%.
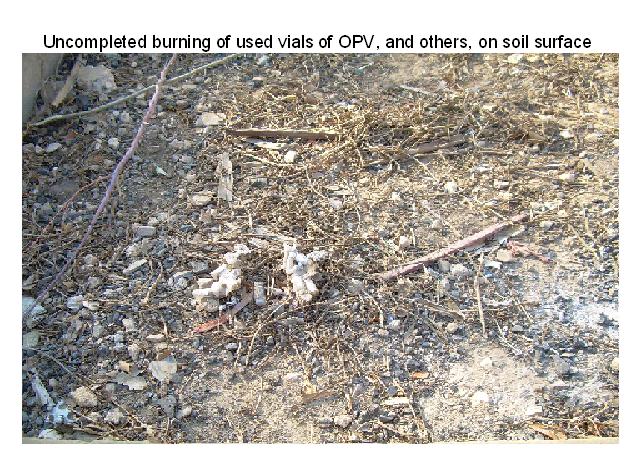
    - Syringes, needles, empty vials are bunt on surface of soil: 85.7%.
    - Syringes, needles, empty vials are bunt or incinerated immediately after discarding them: 21.4%.
    - Safety boxes are bunt or incinerated with contents: 28.6%.

  • Fianarantsoa I and Fianarantsoa II Health Districts, Haute Matsiatra Region.
    (7 vaccination health centres supervised)

    - Needles are not recapped: 100.0%.
    - Syringes and needles are put in safety boxes after use: 100.0%.
    - Syringes, needles, empty vials are incinerated: 14.3%.
    - Syringes, needles, empty vials are bunt in a pit: 71.4%.
    - Syringes, needles, empty vials are bunt on surface of soil: 14.3%.
    - Syringes, needles, empty vials are bunt or incinerated immediately after discarding them: 85.7%.
    - Safety boxes are bunt or incinerated with contents: 85.7%.

  • Mahajanga I and Mahajanga II Health Districts, Boeny Region
    (3 vaccination health centres supervised)

    - Needles are not recapped: 100.0%.
    - Syringes and needles are put in safety boxes after use: 100.0%.
    - Syringes, needles, empty vials are incinerated: 66.7%.
    - Syringes, needles, empty vials are bunt in a pit: 33.3%.
    - Syringes, needles, empty vials are bunt on surface of soil: 0.0%.
    - Syringes, needles, empty vials are bunt or incinerated immediately after discarding them: 100.0%.
    - Safety boxes are bunt or incinerated with contents: 100.0%.

DISCUSSION
The most important route of transmission of poliovirus from person-to-person is via the faecal-oral route. There is a non negligible environmental element in the transmission cycle of poliovirus. When environmental conditions are suitable cVDPVs may also develop in the environment from discarded vials of OPV that are neither burnt nor incinerated immediately, nor well destroyed. The sandy flooded low coastal plain of Toliara may present an ideal milieu for the development of cVDPVs during the cool rainy seasons. The flooding water which consists of both sea water and fresh rain water from the high lands inland may also be favourable for the environmental mutation of attenuated oral polio vaccine virus. Faecal contamination of the environment during the rainy season is very high in the low coastland because of the flooding. Children and the population in general have the habit of sitting directly and playing on the sand; washing of hands before meals may not often be respected especially amongst children. In the hilly regions waste in the environment is easily swept away by rain water. All the four cases of paralytic poliomyelitis due to cVDPVs in Toliara I, Toliara II and Sakaraha Health Districts have a history of staying in quarters of Toliara before onset of illness.

An excellent elaborate laboratory investigation carried out by the “Institut Pasteur de Madagascar” in Toliara Province confirmed the excretion of cVDPVs in stools of children in quarters/villages of the affected children. No case of vaccine-associated paralytic polio (VAPP) was diagnosed. VAPP is paralytic disease occurring in vaccine recipients, or contacts of recipients of OPV. It is extremely rare.
Cases of VAPP are not linked epidemiologically or virologically to each other but are associated with separate recent exposures to OPV. No case of acute flaccid paralysis due to wild poliovirus was confirmed. It is therefore necessary to sensitize the health personnel and the population on the difference between VAPP and cVDPVs because reticence and refusal to take VPO may be developed.

Cases of paralytic poliomyelitis attributed to cVDPVs have also been detected in Haiti, the Dominican Republic, the Philippines, Egypt, Indonesia and Hong Kong (China); these places may have similar environmental features as the sandy low coastal plain of Toliara; and perhaps the problem of post vaccination waste disposal also.

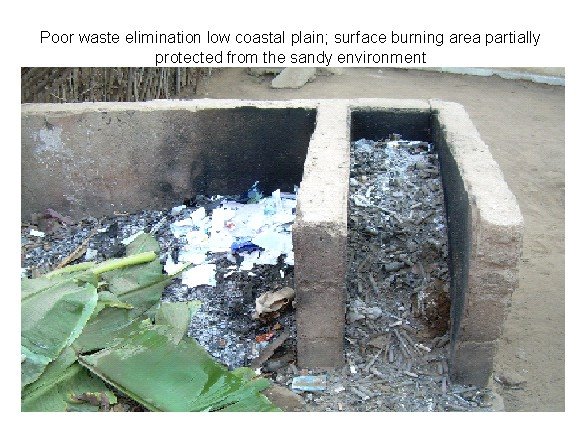
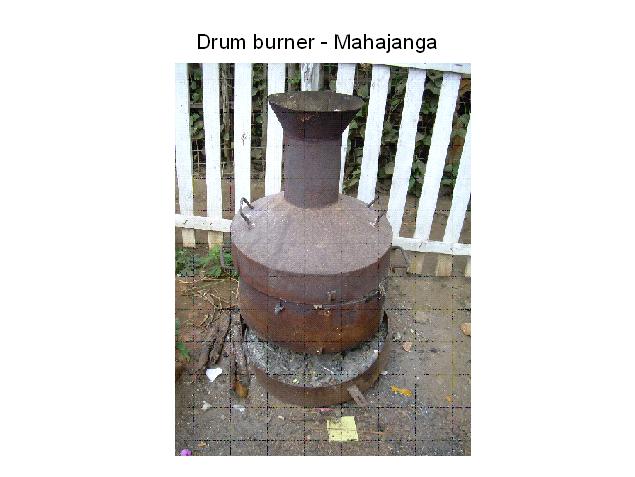
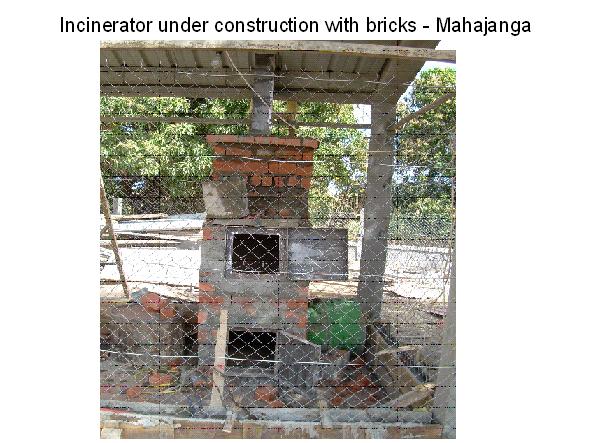
The results of injection security investigation show that the elimination of post vaccination waste was poorest in the Toliara Health Districts amongst the Health Districts considered, because of the inability of the health facilities to maintain their waste pits that are always filled by sand through out the year. Some of the pits are so deep and protected that burning of the waste is extremely difficult and impossible; water still infiltrate into such pits. Most health facilities in Mahajanga have either incinerators or drum burners, while in Haute Matsiatra the use of pit is prominent.

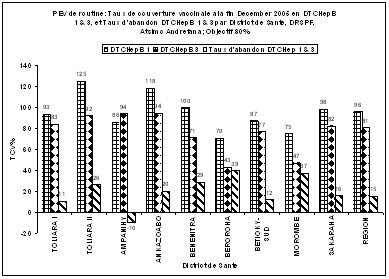
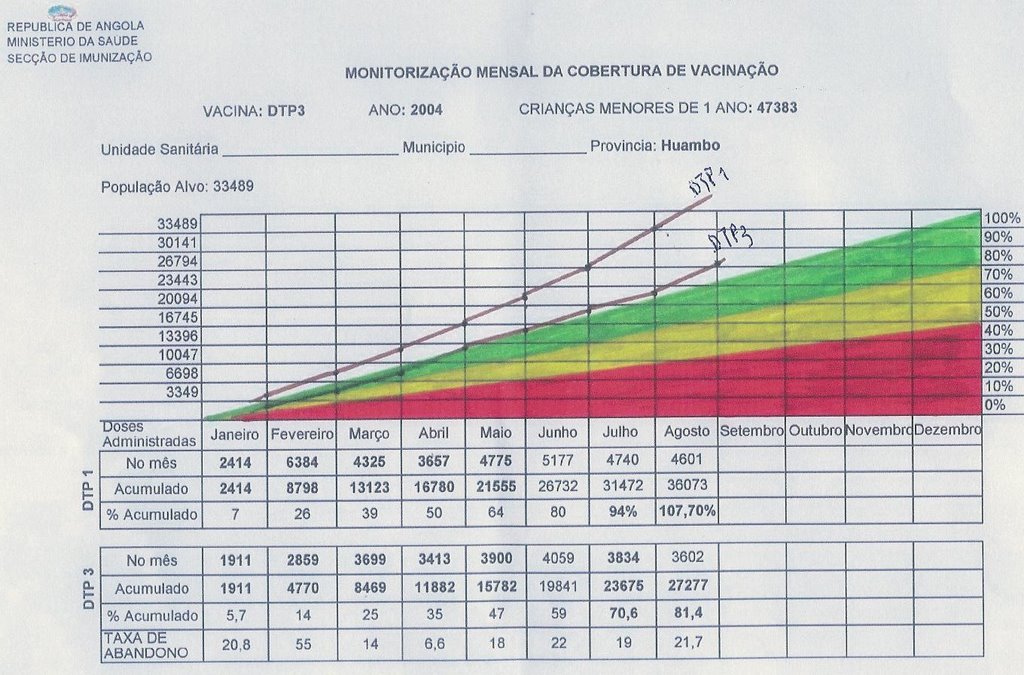
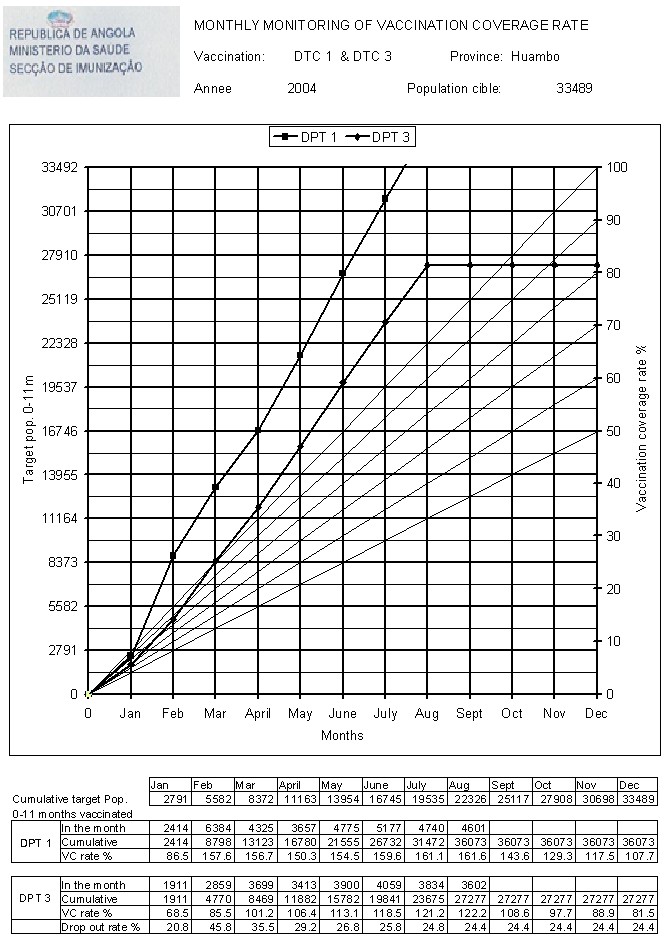
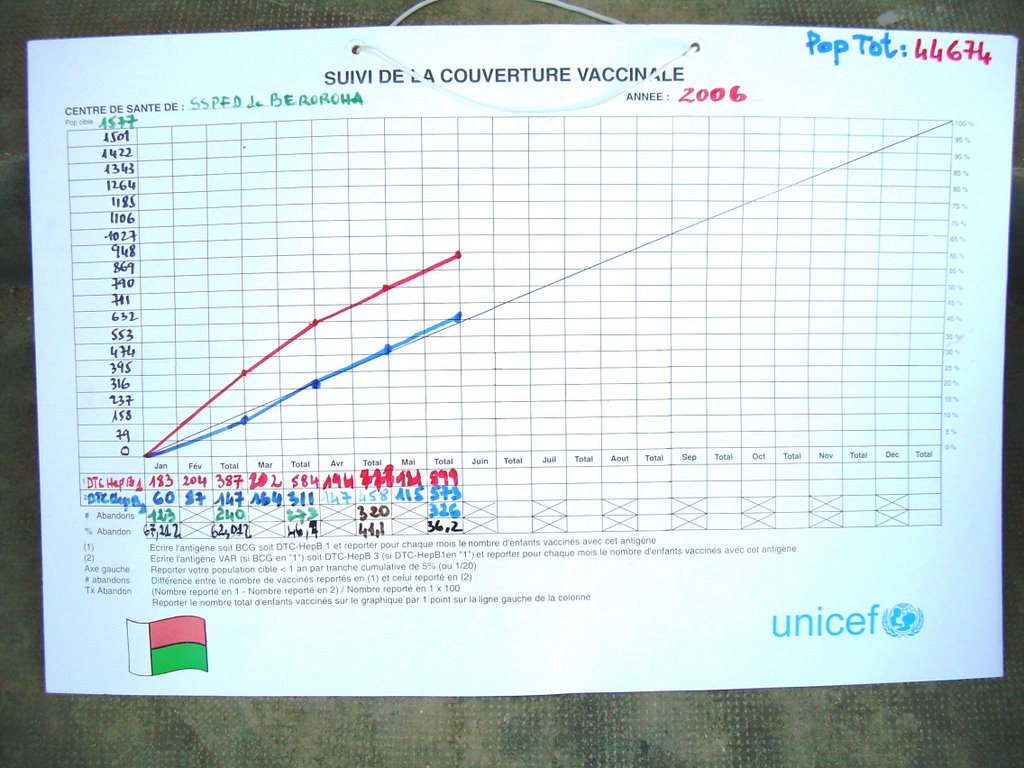
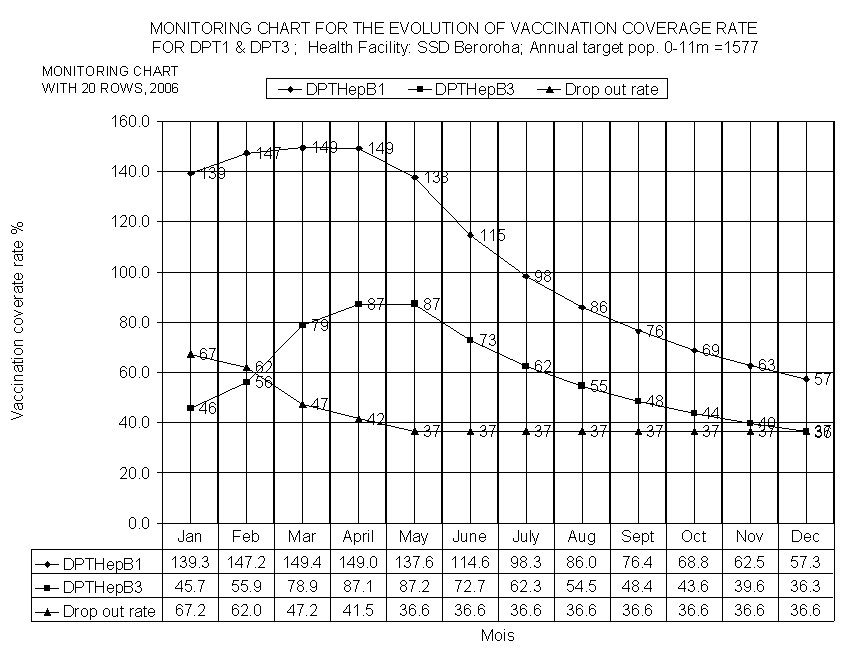
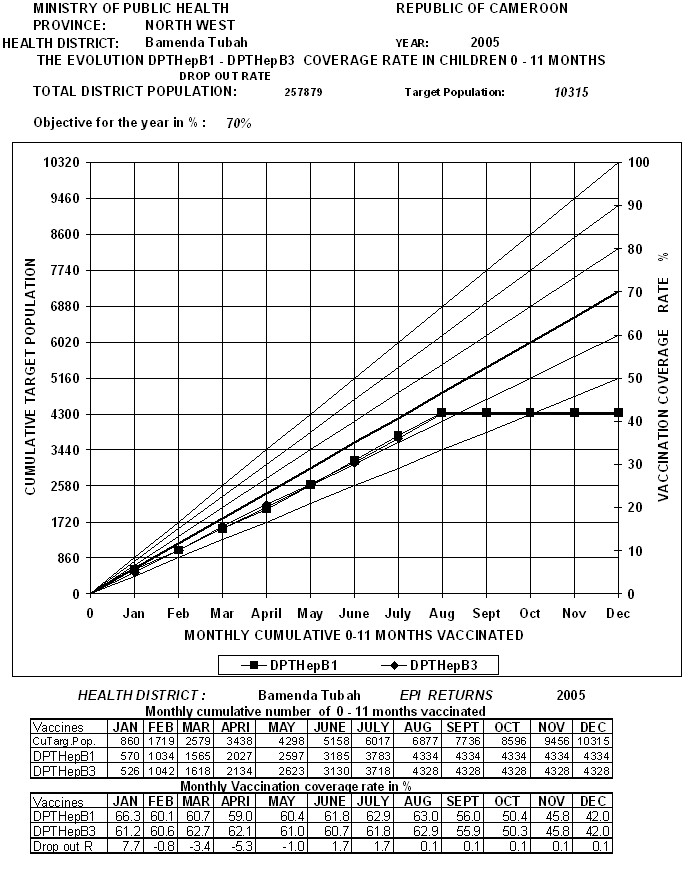
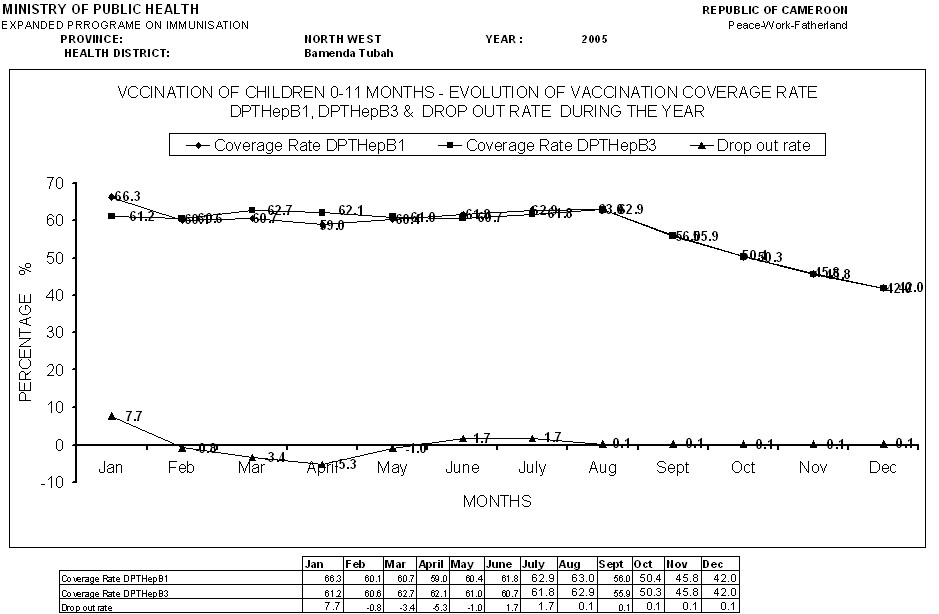
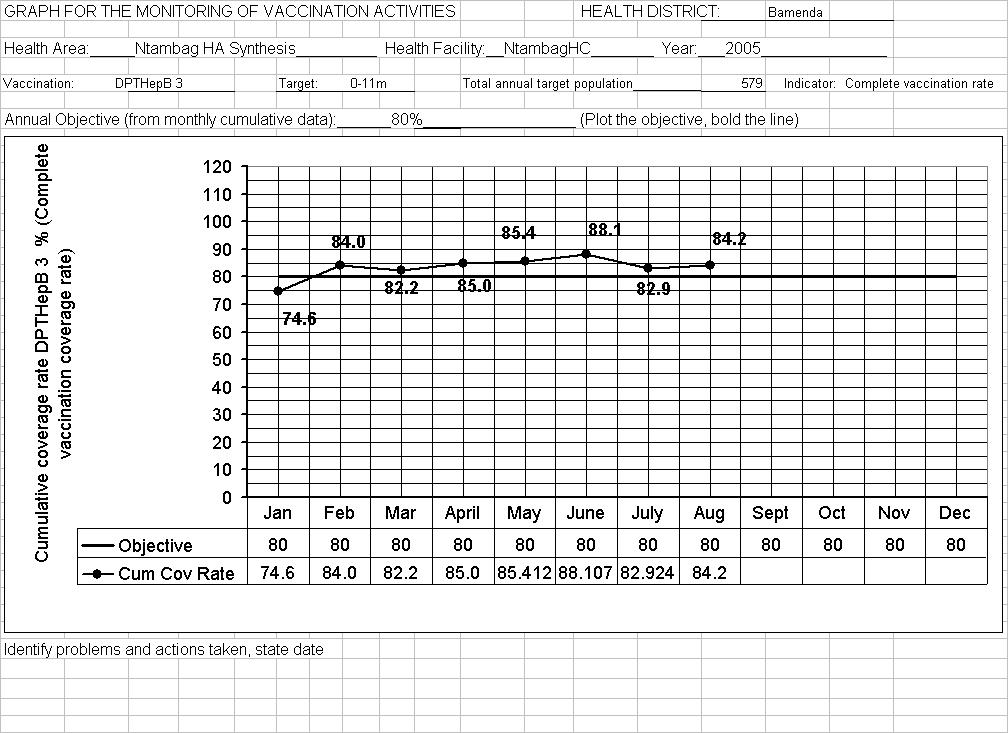
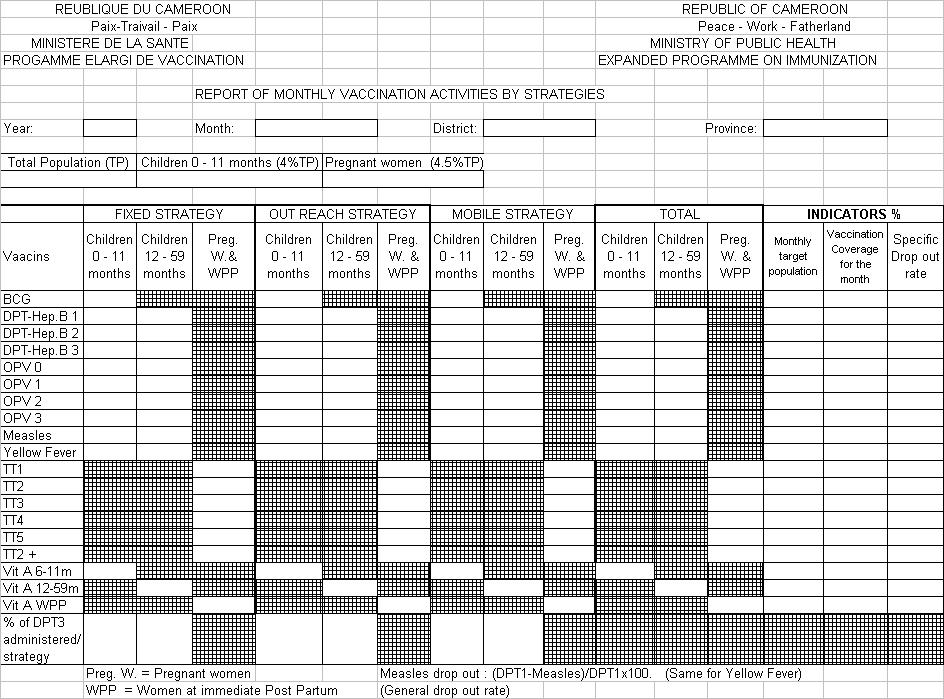
Although the vaccination coverage for the 3rd dose of DPT/OPV at the end of 2005 was high for the three Regions considered, it was relatively low during the first six months of the year.

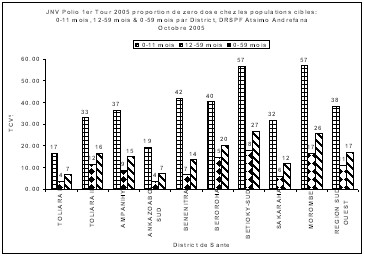
The results of the vaccination campaign against Polio carried out in October as a riposte to the diagnosis of cases of paralytic polio due to cVDPVs in the Region of Atsimo Andrefana showed a high proportion of the zero doses amongst the 0-11 months 38% for the Region.

The most striking differences between the Health Districts considered of the three Regions were:
  • The geographical and physical features – low and often flooded costal plain of Toliara I and Toliara II
  • Nature of the soil – sandy soil in Toliara I and Toliara II
    Post vaccination waste disposal – poor post vaccination waste disposal in Toliara I and II because pits are easily filled by sand
  • Environmental sanitation – faecal contamination of the sandy soil during the flooding season, sitting and playing on the soil and non-washing of hands before meals by children

These findings underscore the need for the strengthening of injection security with emphasis in waste elimination in the health facilities situated in the costal plain of Toliara Health Districts by using adapted incinerators.

There is an ongoing effort by the State to maintain high vaccination coverage rate for Oral Polio Vaccine (OPV) amongst children; but this effort may be undermined by the recurrent diagnosis of cases of paralytic poliomyelitis due to cVDPVs that may also be attributed to poor post vaccination waste disposal in this sandy costal plain of the Province of Toliara.


CONCLUSION
“Low routine vaccination coverage is one of the most important causes of VDPV. Because the location of the originating events is unknown, the contribution of other factors is difficult to access; however, a combination two concurrent events within the virus is necessary for cVDPVs emergence; reversion of attenuating mutations to increase neurovirulence, and a presumed increase in transmission characteristics that might be related to recombination with a nonpolio enterovirus. The molecular basis for the second property is not understood”.

In view of the fact that many events concerning cVDPVs are not yet understood, the best approach to reduce or stop the appearance of cVDPVs will be to eliminate all possible contributing factors by ensuring that the defined simplest activities and tasks in the implementation of EPI are correctly performed.

The hypothesis is that the conditions in the sandy and regularly flooded costal plain may be suitable for the environmental mutation of Oral Polio Vaccine virus into cVDPVs. The fact is that post vaccination waste disposal in the sandy and often flooded coastal plain of Toliara Province is poor and difficult to carry out. It would not be exaggerated to say that vaccines and adapted incinerators should be distributed together to health facilities in this Province at high risk; there may be a possibility for all attenuated live vaccines to undergo mutation in such conditions.

The improvement of post vaccination waste disposal should be based on a multisectoral, community, national and international approach, support, participation and commitment in order to eliminate one of the probable contributing factors for the appearance of cVDPVs – poor post vaccination waste disposal. All personnel of health facilities should be trained on injection security especially waste disposal. Good environmental sanitation is primordial.

This report is based on the observation of the author; a more detailed scientific investigation could be carried out; both laboratory investigation indicators and Expanded Programme on Immunization (EPI) process indicators should be assessed in this sandy often flooded coastal plain in Toliara Province and elsewhere also.

This is the author’s modest contribution towards the global eradication of poliomyelitis.

***Related images are found on the next post of the site.***


REFERENCE:
1) Circulation of a Type 2 Vaccine-Derived Poliovirus—Egypt, 1982–1993 Vol 50, No03;41 01/26/2001

2) Pink book 08 Polio CDC.

3) Rakoto Andrianarivelo Mala, Unité de Virologie, Institut Pasteur de Madagascar, Réunion Sahamadio Ilfay Octobre 2005 ; Surveillance des PFA à Madagascar (Janvier – 21 Octobre 2005).

4) Dr Julienne Raneboarisoa – DRSPF à Toliara, PF Surveillance, Rapport de Surveillance Active de la Région d’Atsimo Andrefana

5) Circulation of a Type 2 Vaccine-Derived Poliovirus—Egypt, MMWR 1982–1993 Vol 50, No. 03;41 01/26/2001

6) Public Health Dispatch: Acute Flaccid Paralysis Associated with Circulating Vaccine-Derived Poliovirus—Philippines, MMWR 2001

7) Progress Toward Global Eradication of Poliomyelitis, MMWR 2001 Vol 51, No 12;253 -256, 03/29/2002

8) Public Health Dispatch: Poliomyelitis — Madagascar, MMWR 2002 Vol 51, No 28;622,07/19/2002

9) Progress Toward Global Eradication of Poliomyelitis, MMWR 2002 Vol 52, No 16;366 04/25/2003

10) What STOPers should know about Vaccine-Associated Paralytic Polio (VAPP) and Vaccine-Derived Polioviruses (VDPV) STOP 22 Training CDC, Atlanta May 2006

11) 42 MMWR January 26, 2001

12) World Health Assembly. Global eradication of poliomyelitis by the year 2000. Geneva, Switzerland: World Health Organization, 1988 (Resolution no. 41.28).

13) CDC. Progress toward global poliomyelitis eradication, 1999. MMWR 2000;49:349–54.

14) CDC. Progress toward the global interruption of wild poliovirus type 2 transmission, 1999. MMWR 1999;48:736–8.

15) Vol. 52 / No. 38 MMWR 915

16) Rapport du Comité National de Certification de l’Eradication de la Poliomyélite de Madagascar, Année 2004, Service de vaccination, Ministère de la Santé

17) Rapport du Comité National de Certification de l’Eradication de la Poliomyélite de Madagascar, Année 2005, Service de vaccination, Ministère de la Santé.
***Related images are found on the next post of the site.***


Saturday, September 02, 2006

MONITORING CHARTS FOR ROUTINE EPI, August 2006.

MONITORING CHARTS FOR ROUTINE EXPANDED PROGRAMME ON IMMUNISATION (EPI), August 2006.


INTRODUCTION

There is a multitude of EPI monitoring charts or graphs of different formats from a variety of sources in use by health actors.

The five operational components of the Reaching Every District (RED) strategy proposed by the Global Alliance for Vaccines and Immunisation (GAVI) partners in 2003 (Mid-Level Management (MLM) Course for EPI Managers, WHO) are:
  • Re-establishing outreach vaccination: regular outreach visits to underserved communities
  • Supportive supervision: on-site training by supervisors
  • Strengthening links between community and service: regular meetings between community and health staff.
  • Monitoring for action: collecting and using quality data at all levels and through monitoring charts, maps for each facility
  • Planning and management of resources: better management of human and financial resources.
This contribution will be based on the monitoring for action.

‘Monitoring refers to reviewing, on continuous basis, the degree to which program activities are completed, targets are being met. This allows corrective action to be taken during program implementation’ (MSH&WHO Management of Drug Supply)

Monitoring is keeping track of ongoing operational activities, milestones or objectives attainment, the use of budget, staff time and other resources. It facilitates reprogramming of strategy, and eventual evaluation (MLM). Monitoring should be carried out at all levels using appropriate and adaptable tools.

Specifically, the progress of the implementation of any plan can be monitored by measuring achievement of certain milestones or intermediate objectives.

The objective of the immunisation programme is to reach high vaccination coverage rates of the target population through provision of quality services, using the available human, material and financial resources, so as to reduce morbidity and mortality, eliminate or eradicate the diseases using available vaccines. In order to measure all the above parameters in the programme, the monitoring indicators are categorised into key areas (MLM):

Input indicators – immunisation policies, resource inputs (human, material, financial). These are pre-requisite indicators for implementation.

Process indicators – examine functionality and quality of immunisation system and includes all activities: planning, financing, quality of service delivery, immunisation safety, assessment of the programme and its efficiency.

Output indicators – vaccination coverage rates, set objectives and milestones.

Impact indicators
– reduction of morbidity and mortality of targeted diseases

Outcome indicators – related to achievement of final goal e.g. polio eradication, neonatal tetanus elimination.
  • Monitoring of output indicators – vaccination coverage rates and set objectives - to improve quality of routine EPI will constitute this contribution:
    The vaccination coverage rate expressed in percentage for each EPI antigen at the end of each month is the total cumulative vaccinated number of target population since January of the year divided by the total cumulative target population of the same month since January multiplied by 100.
  • The drop out rate expressed also in percentage is used for multiple vaccines – DPT, Polio; or BCG and Measles; DPT1 and Measles, etc. It is calculated at the end of each month thus, as example: (Cumulative vaccinated number of 0-11m having received DPT1 - Cumulative vaccinated number of 0-11m having received DPT3) divided by Cumulative vaccinated number of 0-11m having received DPT1 multiplied by 100
These indicators are usually presented in the form of charts, graphs, or maps to enhance easy visual appreciation of their trends in relation to set objectives.
Monitoring charts, graphs and maps should:
  • Be used at all at levels of the health system in the same format.
  • Provide trends of evolution vaccination coverage rates of health areas, districts, regions, provinces and the nation at the end of each month using cumulative data since January of the year
  • Help health staff obtain information for improving and strengthening EPI activities
  • Assist in identifying training needs necessary to improve EPI activities.
  • Assist supportive supervision in assessing data compiling, analysis and interpretation, completeness and timeliness of routine reporting in the health system.
  • Enhance the analysis and interpretation of data collected at all levels for decision making and action by health actors at all levels
  • Facilitate visualization of the trends of vaccination coverage rate.
  • Be produced with computer in the same format at all levels of the health level
  • Be easily interpreted by health staff at all levels of health system world wide
  • Have a universal name.
  • Show the vaccination coverage rate that would be calculated from cumulative vaccination data at end of each month of the year
  • Be universally and scientifically valid.
  • Indicate whenever possible the proportion of the target population vaccinated at the end of each month of the year
  • Facilitate the identification of implementation problems and intervention in the community
  • Enhance feed back and dissemination of information just by using diagrams.
  • Be easy to reproduce locally by users.
  • Help target supervision to problem areas.
This contribution will be based only on charts or graphs for the monitoring of vaccination coverage rates because of the inability of health staff to correctly fill and interpret the numerous types of monitoring charts or graphs they use. There is more often no or very little action taken in the community because of the poor interpretation of present graphs.

GOAL
Propose charts or graphs for the monitoring of vaccination coverage rates using cumulative data in routine EPI


SPECIFIC OBJECTIVESi) Study some monitoring charts used by health staff.
ii) Present and describe the proposed monitoring graphs
iii) Propose community monitoring tools for vaccination coverage rate


METHOD
Monitoring charts in some reference documents and in Bamenda Health District are reviewed and their data used to produce graphs to explain this contribution to data analysis and information management for decision making.

The charts studied are:
- Cumulative Coverage and drop out monitoring chart, in Immunization Essentials, A practical field guide.

- Monthly monitoring of vaccination coverage rate in Huambo Province in 2004 in Angola. The Reaching Every District (RED) approach of routine immunization service delivery, presentation during the STOP 22 Training May 2006

- A monitoring chart with twenty rows

- Bamenda (Cameroon) Health District monitoring graphs August 2005
Alternative health facility monitoring chart and community monitoring tools of vaccination coverage rate are proposed.

**All the diagrams are presented at the end of the write up in order to facilitate the insertion of this contribution to improve monitoring charts in EPI into the web site: http://www.mfonfudaniel.blogspot.com/.
RESULTS
a) Cumulative Coverage and drop out monitoring chart, in Immunization Essentials, A practical field guide.

Cumulative percentages are placed in the principal y-axis while cumulative target population is on the secondary y-axis. It is like the World Health Organisation (WHO) model although in WHO monitoring chart the cumulative target population is on the principal y-axis. Nevertheless in some WHO documents cumulative percentages and target population are placed indifferently either on the primary or secondary y-axes; sometimes target populations are put on both axes. It contains 13 rows with the first row serving as zero. It has two columns for each month each month except for January, one for children vaccinated in the month and the other for total (cumulative number vaccinated since January). It has an oblique line running from 0 at the principal y-axis to the 13th row at the secondary y-axis, which serves as a fixed objective. The drop out rate is calculated on the chart. It does not give the vaccination coverage rate that is usually calculated from cumulative data. The WHO chart shows the proportion of the total target population vaccinated at the end of the month read by extension on the secondary y-axis. Some field workers say it shows the ‘achievement rate of the objective’ or ‘cumulative vaccination coverage’. It cannot be produced by computer in the present format. Using the data on the chart a graph has been produced with the computer that shows obliquely the vaccination coverage rate as would be calculated from cumulative data. The objective can be set using one of oblique lines that indicate a vaccination coverage rate; the proportion of the annual target population vaccinated can be read from secondary axis by projecting the point on the month horizontally to it. One other graph has been developed with the computer that shows monthly evolution of vaccination coverage rate and drop out rate in lines calculated from cumulative data.

b) Monthly monitoring of vaccination coverage rate in Huambo Province in 2004 in Angola.The chart is similar to the one described above; the percentage is at the secondary y-axis. There is only one column per month, offering a possibility to produce it with the computer. The proportion of the annual target population is calculated instead of the vaccination coverage rate using the corresponding cumulative data. Supplementary graphs were also produced from the data of Huambo Province; they show high vaccination coverage rates for DPT1 and DPT3 increasing suddenly from January, and high drop out rate.

c) A monitoring chart with twenty rows.

The chart is similar to that of 13 rows; the percentage is at the secondary y-axis. It cannot be produced with the computer. The plotting of data and interpretation of this chart by health staff is extremely difficult.

d) Bamenda Health District Monitoring graphs August 2005.

The ‘oblique chart’ is based on the monitoring chart in the Norms and Standards of the Expanded Programme on Immunisation (EPI) of Cameroon. It is a square divided into 12 rows and 12 columns, with the cumulative target population at the primary y-axis and the vaccination coverage rate at the secondary y-axis. It shows the vaccination coverage rate between two oblique lines and the proportion of the annual target population vaccinated from the point on the month projected horizontally on the secondary y-axis. It is produced with the computer. Supplementary graphs were programmed and produced to enhance the appreciation of the monthly performance of each health area, and the monthly evolution of vaccination coverage rate in the course of the year.

e) Proposed chart for the monitoring of vaccination coverage rate – read between oblique lines.
- The chart is a square of 12 principal gridlines (vertical and horizontal) at equal interval.

- The abscise (X): The principal line corresponds to the end of each month from January to December. The monthly cumulative number of vaccinated target since January is plotted on the vertical gridlines of this axis.

- The primary ordinate (Y) is for the cumulative target population. Divide the known or estimated target population at the beginning of the year by 12 to obtain the interval between two principal lines. The first principal line is equal to the value of the interval, the second is the value of the interval multiplied by 2; continue thus until the 12th principal line which should correspond to the annual target population.

- The secondary ordinate indicates the vaccination coverage rates in percentage. Oblique lines connect the zero point of the graph to percentages on the secondary ordinate. The space between two oblique lines shows the vaccination coverage rate range in percentage. Projecting a horizontal line from the plotted point of the month to secondary ordinate gives the proportion of the annual target population vaccinated for the given month.

When to use it:
At the end of the month after having made the synthesis of vaccination data. It can also be used for other health activities for which the annual target populations are known or could be estimated at the beginning of the year - general consultations, ANC, IWC, etc.

How to use it:
Fill the name of country, the year; the name of the Province/Region, Health District, Health Area/Health Centre, depending on the level; the annual total population of the level concerned; the vaccines; the annual target population; and the set objective of the vaccination coverage rate for the year in percentage. Indicate the set objective on one of the oblique lines that corresponds to it (bold the line). Divide the target population by 12 and write the values at the principal lines of the ordinates (Y) as described above. From the monthly EPI synthesis extract the number of the target population vaccinated for the month according to the vaccines considered and fill the table below the graph. Calculate the cumulative number of the target population vaccinated for the month since January. Plot this cumulative number at the end of each month on the corresponding principal line of the abscise (X). Joint the points plotted; use a specific style for each vaccine curve. Compare the curve thus produced to the set objective line for the year: if the curve is above the oblique line objective, the vaccination coverage rate in the community may be good; if the curve is below the vaccination coverage rate may be low. Calculate the drop out rate according to the formula provided and fill the corresponding cell for the month. In order to know exactly the vaccination status, calculate the vaccination coverage rate at the end of each month with the cumulative data for the month using the appropriate formula and fill the corresponding cell. Use the information thus obtained to make decisions, and carry out activities both in the community and at the health facility to consolidate or to improve the vaccination coverage rate.

Who should use it:
It should be used at all levels of the health system: Health Area, Health Facility, Health District, Health Province, Heath Region, and Ministry of Public Health.

Advantages of the chart:
Only data from the EPI monthly report are used; no vaccination coverage rate is calculated before hand. It permits the estimation and the visual appreciation of the evolution of vaccination coverage rate during the year. One obtains information for decision making and local intervention. It facilitates supervision; obliges the supervisor to verify the registers and monthly returns, and to propose actions to improve and consolidate the vaccination coverage rate. It can be produced and programmed with computer in its present format.

Disadvantage:
The increasing appearance of the graph may give a false impression that all is going on well; therefore great care should be taken in interpreting it.

f) Proposed chart for the monitoring of vaccination coverage rate calculated from cumulative data.- It is a simple chart producing curves in lines.

- The abscise (X): The principal line corresponds to the end of each month from January to December. The vaccination coverage rate calculated from monthly cumulative data is plotted on the vertical gridline of the respective month of this axis.

- The primary ordinate (Y) shows the range of the vaccination coverage rate with percentages indicated against the principal gridline.

- When to use it: At the end of the month after having made the synthesis of vaccination report and calculated the vaccination coverage rate using cumulative data. It can also be used for other health activities for which the monthly coverage rate can be calculated.

How to use it:
Fill the name of country, the year; the name of the Province/Region, Health District, Health Area/Health Centre; the annual total population of the level concerned; the vaccines; the annual target population; and the set objective of the vaccination coverage rate for the year in percentage. Indicate the set objective on one of the horizontal gridline of the y-axis lines that corresponds to it (bold the line). From the monthly EPI returns extract the number of the target population vaccinated for the month according to the vaccines considered and fill the table below the graph. Calculate the cumulative number of the target population vaccinated for the month since January. Calculate the vaccination coverage rate using the cumulative data at the end of each month according to the formula provided, fill the corresponding cell of the table and plot it on the principal line of the abscise (X) for the month. Joint the points plotted; use a specific style for each vaccine curve. Compare the curve thus produced to the set objective line for the year: if the curve is above the objective line, the vaccination coverage rate in the community may be good; if the curve is below the vaccination coverage rate is may be low. Calculate the drop out rate according to the formula provided and fill the corresponding cell for the month in the table. Use the information thus obtained to make decisions, and carry out activities in the community and at the health facility to consolidate or to improve the vaccination coverage rate.

Who should use it:
It should be used at all levels of the health system: Health Area, Health facility, Health District, Province, Region, and Ministry of Public Health.

Advantages of the chart:
It permits the horizontal visualization of the evolution of exact calculated vaccination coverage rates using cumulative data during the year. It facilitates the appreciation of trends, identification anomalies, and taking of corrective measures monthly.

g) Community monitoring tools of vaccination coverage rate.
The tools have been developed within the premise of strengthening links between community and service. At the first level health facilities in most countries there are dialogue structures or organs (Health Committee) that promote community participation in health programmes including EPI. There are community mobilisers or animators who work in collaboration with health staff to sensitize the population on vaccination, and carry out active search for drop outs and active surveillance in the community. Proximity social mobilisation that is usually done will be facilitated by using the form for assessing the vaccination status of children less than one year. The synthesis of the data collected will provide information that will first of be motivating to staff and community animators, and then serve as concrete fact and information for feedback to the community thereby stirring up the parents of the various quarters to bring out their children for vaccination. The data collection and synthesis forms are easy to fill and produce. This community monitoring does not necessarily need any scientific approach of sampling because it is used by community mobilisers in their respective quarters.


DISCUSSION

The essence of the monitoring of the vaccination coverage rate is action oriented based on the information obtained from the interpretation of results provided by monitoring tools; the better the quality of the monitoring tool the more accurate and effective the information as shown by the supplementary graphs produced with data of monitoring charts of reference documents in this write up.

The EPI has a spiral target population with a cross section being a year starting from January to December. The population does not evolve in a straight line but in a spiral form and as such the vaccination coverage rate cannot start from zero at the beginning of the year. It has been observed that surveys carried out in the community at any time of the year to evaluate the vaccination coverage rate produce results that correspond to or are more compatible with vaccination coverage rates calculated from monthly cumulative data than those calculated from cumulative percentages or with monthly population that is the same for each month of the year.

The author, based on his personal working experienced, publications, and field evaluation, has proposed some charts for the monitoring of vaccination coverage rates using cumulative data:

i) At health service level with administrative EPI data
  • Monitoring chart with oblique lines showing vaccination coverage rates obtained from cumulative data at the end of each month. The vaccination coverage rate is estimated between two oblique lines. This chart is good for vaccination coverage rates that are below 100%. The evolution of the vaccination coverage rate should be interpreted carefully because it is increasing within a range of percentage from January and not in absolute percentage.
  • Monitoring chart or graphs with horizontal lines showing the monthly evolution of vaccination coverage rate calculated from cumulative data at the end of each month. This chart can be used for vaccination coverage rates below and above 100%, but the vaccination coverage rates have to be first of all calculated. This chart shows that the objective should be attained each month but not at the end of the year. It is the simplest and most explicit chart.
  • Monitoring chart at the level of the Health District that show the monthly performance of each health area or health centre at the end of month using bars should be elaborated as in Bamenda Health District (August 2005); same should be done at the level of the Province/Region and Ministry of Public Health.
ii) Ccommunity proximity social mobilisation should be based on facts that are obtained by the intermittent assessment of vaccination status of children 0 – 11 months in the community by social mobilisers/animators and health staff of the health centre, using the appropriate community monitoring tools proposed in this write up. By so doing a strong community adhesion to and participation in EPI will be achieved. The results thus obtained could be compared with those of routine administrative EPI data.
  • Form for the Community Monitoring of vaccination coverage rate of children 0 - 11 months
  • Form for the Synthesis of Community monitoring of vaccination coverage rate of children 0 - 11 months.

CONCLUSION

In most reference documents on EPI the calculation of vaccination coverage rate using cumulative data is clearly defined. It is therefore necessary that monitoring charts should be designed to produce the same vaccination coverage rates so that they can be easily visualized; otherwise health staff will resort to calculating the vaccination coverage rates, or create other tables or graphs to enable them appreciate their performance, or will be confused.

It is highly recommended these proposed charts and those existing in the field should be tested so that more efficient universal tools for the monitoring of vaccination coverage rates calculated from cumulative data in the Expanded Program on Immunization could be adopted and put in place in order to ameliorate the performance of health actors.

The author is available to provide his modest contribution to the improvement of monitoring charts or graphs to be used by health services for the monitoring of vaccination coverage rates in EPI.

Acknowledgement should be made to the author for the use of extracts of this document.

REFERENCES:1) Immunization Essentials, A practical field guide. USAID, ISBN 0-9742991, October 2003.

2) Managing drug supply, Second edition, 1997, Management Sciences for Health & World Health Organisation.

3) Mid-Level Management (MLM) Course for EPI Managers, WHO

4) DQA reports for Cameroon, WHO

5) Immunization in Practice DIP-755; WHO/IVB/04.06

6) Expanded Programme on Immunisation (EPI) in Bamenda health district- Cameroon from 1999 – August 2005 (September 2005); Dr Mfonfu Daniel; web site: www. mfonfudaniel.blogspot.com

7) Demographic and health survey 2004, Cameroon; Vaccination coverage rate in children 12-23 months

8) Normes et Standards du Programme Elargi de Vaccination (PEV), Cameroun, Ministère de la Santé Publique, Janvier 2005.
**All the diagrams are presented at the end of the write up in order to facilitate the insertion of this contribution to improve monitoring charts in EPI into the web site: http://www.mfonfudaniel.blogspot.com/.


Friday, February 10, 2006

AUTHENTICITY OF DATA OF ROUTINE EPI

AUTHENTICITY OF DATA OF ROUTINE EXPANDED PROGRAMME ON IMMUNISATION (EPI) AT THE LEVEL OF THE HEALTH DISTRICT


INTRODUCTION

The monthly routine EPI indicators of the Health District should be authentic, valid and credible. It is therefore imperative that at all levels of data processing, the data in all the recoding documents should conform and be the same; and that the assessment of the vaccination status of children in the community should produce results corresponding to or better than those declared routinely.

The Norms and Standards of the Expanded Programme on Immunisation (EPI) of Cameroon define the policy and modalities for the administration of vaccines to children aged 0-11 months and pregnant women. This policy document presents the tools for the monthly reporting and monitoring of EPI activities at the level of the health facility, the health area, and the Health District. Registers and tally sheets for children and pregnant women were conceived, produced and distributed to all health Districts by the Central level. Vaccination cards for children 0 – 11 months were also produced and are being given to them free of charge. At the level of the health facility vaccination is carried out and the vaccinated recorded.

The linkage and verification of the data between the principal tools cited above at the level of the health area and the Health District is usually very difficult because of the lack of standardised intermediate tools for the synthesis of monthly EPI data. The author initiated intermediate tools and computer excel programmes that facilitated EPI data processing by the Health Centre and the Health District Service Teams in Bamenda Health District, thus permitting the production of results of routine EPI returns from 1999 to August 2005.

During the synchronised national immunisation days against Polio from 9 – 11 November and 9 – 11 December 2005, the author carried out an integrated supervision concerning the National Immunisation Days (NIDs) and routine EPI, as prescribed to all Provincial Supervisors in Santa Health District. The supervision results on the NIDs had been presented in another report.

This write up will be based only on the supervision of activities and tasks of routine activities of EPI.

This supervision in Santa Health District was used just as an example to highlight some of the problems faced by most Health Districts in processing routine EPI data.

GENERAL OBJECTIVE

Improve the capacity and performance of staff in the activities and data processing in routine EPI at the Health Area and Health District levels.

SPECIFIC OBJECTIVES1) Assess performance in the following domains:

a) Infection prevention - decontamination – laboratory
b) Infection prevention – decontamination – maternity
c) Waste disposal
d) Cold chain
e) Management of materials and vaccines
f) Injection security
g) Monitoring of vaccination coverage
h) Acute Flaccid Paralysis (AFP) surveillance
i) Tools used

2) Propose some intermediate tools for enhancing processing and verification of routine EPI data.


METHOD
A questionnaire based on the terms of reference for provincial supervisors, and on the Norms and Standards on EPI of Cameroon was established and applied by response, and verification wherever possible. During the first round in November 2005 emphasis was laid on the cold chain; the more elaborate questionnaire was used during the second round in December 2005 when all health areas were visited.

Feedback was given immediately and during evaluation meetings on the identified strengths, weaknesses, potentials, and together with the health teams solutions to weaknesses were developed. Some tools for enhancing processing and verification of routine EPI data were provided to the health teams.

RESULTS:

A. ROUND FOUR SNIDs 09 – 11 NOVEMBER 2005
I. COLD CHAIN
  • The centre has a functional refrigerator-----------------------------------7/8 (87.5%)
  • Type fridge: 2 Gas; 2 Kerosene; 2 Electric; 7 out of 8 centres visited, Buchi Health Centre has no fridge.
  • Refrigerator is correctly installed----------------------------------------------7/7 (100.0%)
  • Refrigerator has its temperature chart ---------------------------------- 7/7(100.0%)
  • The temperature chart is pasted on fridge ----------------------------- 7/7 (100.0%)
  • The fridge has a thermometer ----------------------------------------------7/7 (100.0%)
  • Temperatures are noted twice a day ----------------------------------------- 7/7 (100.0%)
  • Temperature is written with - or + in front of figures ---------------- 1/7 (14.3%)
  • Temperature ranges between (+20 C and +80 C) for the fridge for the last two weeks ----- applicable only in one health facility (14.3%)
  • Abnormal temperatures are noted with red colour ---------------------1/1 (100.0%)
  • POLIO is in the freezing compartment of the fridge of HC/Health Facility--- 7/7 (100.0%)
  • DPTHepB; TT; BCG, Measles, YF are in the cooling compartment ----- 7/7 (100.0%)
  • Ice packs are kept in freezing compartment of the fridge --------------- 7/7 (100.0%)
  • Ice packs are well arranged vertically in freezing compartment -------- 2/7 (28.6%)
  • Fridge is well maintained (not full with ice, and clean) ---------------- 5/7 (71.43%)
  • Things other than vaccines not found in the refrigerator --------------------7/7 (100.0%)
  • Opened vaccine vials BCG/Measles/YF not found in the fridge ---------7/7 (100.0%)
  • Vaccines are scattered in the fridge ----------------------1/7 (14.3%)
  • DPTHepB, TT, OPV, are given daily in a centre having a fridge (excluding District Health Service) --------5/6 (83.6%)
  • Quantity of Oral Polio Vaccine with VVM bad: 3700 doses (District health service 2000 and Bali Gham Health Centre1700)
  • The District Service has a deep freezer ----------------------------------1/1 (100.0%)
  • The temperature chart is pasted on the deep freezer ------------------- 0/1 (0.0%)
  • The deep freezer has a thermometer -------------------------------------- 1/1 (100.0)
  • Temperatures are noted twice a day ------------------------------------ 0/1 (0.0%)
  • Temperature is written with - or + in front of figures ---------------- 0 (0.0%)
  • Temperature ranges are between (-15°C to – 25°C) for the deep freezer for the last two weeks --- not recorded
  • POLIO is in the deep freezer at the District Health Service -------------------- 0 (0.0%)
  • Ice packs are kept in the deep freezer at the District Health Service ----- 0 (0.0%)
  • Ice packs are placed vertically in the deep freezer at the District Health Service -----0 (0.0%)

II. MANAGEMENT OF MATERIALS AND VACCINES
  • There is a register/form for vaccine stock management --------6/8 (75.0%)
  • No shortage of vaccine since last 3 months ------------ 8/8 (100.0%)
  • Auto-destruct syringes are in sufficient quantity ---------8.8 (100.0%)
  • Kerosene reserve (minimum 5l) ---------------------------2/2 (100.0%)
  • There is a stand by bottle of gas ---------------------------2/2 (100.0%)

III. MONITORING OF VACCINATION COVERAGE
  • The graph for the monitoring of vaccination coverage at HF is used ------- 2/8 (25.0%) Awing HC and the District Health Service
  • The annual objective for the vaccination coverage is indicated ---------- 2/8(25.0%) Awing HC and the District Health Service
  • Problems are identified from the graph and written ------------------------------------1/8 (12.5%) District Health Service
  • Actions are taken to improve or consolidate the coverage ---------------1/8 (12.5%) District Health Service
  • Feed back on monitoring graphs from the District Service -------------- 7/7 (100.0%)

IV. AFP SURVEILLANCE
  • Supervisors review Consultation registers ---------------------- 6/7 (85.71%)
  • Consultation registers are reviewed and signed by supervisors ---------5/7 (71.4%)
  • Case definitions of diseases under surveillance (AFP, measles, etc) are displayed at HF- ----- 3/7 (42.86%)
  • Social mobilisers carry out active search for cases of AFP in the community ---------7/7 (100.0%)
  • Social mobilisers have copies of case definitions of especially AFP, Yellow fever, etc, -0/7 (0.0%)
  • Health staffs carry out active search for AFP in the community by ------ 7/7 (100.0%)

V. TOOLS USED
  • The current recommended monthly EPI return form is used ----------------------6/8 (75.0%)
  • The current recommended tally sheets are used at vaccination centre --- ------- 7/7 (100.0%)
  • Health area synthesis from different vaccination centres are made and attached to the health area monthly return form – 0/2 (0.0%)
  • The indicators on monthly EPI return form are correctly calculated ----6/8 (75.0%)
  • Monthly Return per strategy is made ---------------------------------------7/8 (87.5%)
  • Monthly Stock management Return is made ------------------------------5/8 (62.5%) not done at the District Service

B. ROUND FIVE SNIDs 09 – 11 DECEMBER 2005

I. INFECTION PREVENTION – DECONTAMINATION – LABORATORY
  • Prepares the 0.5% chlorine solution for decontamination ----------------- 6/9 (66.67%)
  • Soaks instruments in decontamination solution for 10 minutes immediately after use –5/9 (55.6%)
  • Does not recap needles after use --------------------------5/9 (55.6%)
  • Puts syringes and needles in a puncture proof safety box -----------------6/9 (66.67%)

II. INFECTION PREVENTION – DECONTAMINATION – MATERNITY
  • Prepares the 0.5% chlorine solution for decontamination -----------------6/9(66.67%)
  • Soaks instruments in decontamination solution for 10 minutes immediately after use ----6/9(66.67%)
  • Clean the delivery bed after each delivery with the decontamination solution --------6/9 (66.67%)
  • There is a placenta pit--------------------------------------------------------3/9(33.3%)

III. WASTE DISPOSAL
  • Uses a dust bin with a cover --------------------------------------------------7/12 ((58.33%)
  • Wears utility gloves to clean and dispose waste --------------------------5/12 (41.67%)
  • Places all sharps in a puncture proof recipient ---------------------------11/12(91.67%)
    Empties dust bin once a day ---------------------------------------------------5/12 ((41.67%)
  • Decontaminate the dust bin before cleaning ----------------------------------------3/12 (25.0%)
  • Removes utility gloves and decontaminate them for 10 minutes before washing ---2/12 (25.0%)
  • Waste is incinerated (There is an incinerator) ----------------------------1/12 (8.3%)
  • There is a pit -----------------------------------------------11/12 (91.8%)
  • Waste is burnt before burning ---------------------------------------1/12 (8.3%)

IV. COLD CHAIN
  • The centre has a functional refrigerator-----------------------------------10/11 (90.91%)
  • Type of refrigerator: 2 Gas; 2 Kerosene; 6 Electric. All health areas have at least one fridge except Buchi health area.
  • Refrigerator is correctly installed----------------------------------------------9/10 (90.0%)
  • Refrigerator has its temperature chart ---------------------------------- 10/10 (100.0%)
  • The temperature chart is pasted on fridge ------------------------------ 10/10 (100.0%)
  • The fridge has a thermometer ----------------------------------------------10/10 (100.0%)
  • Temperatures are noted twice a day -----------------------------------------10/10 (100.0%)
  • Temperature is written with – or + in front of figures ----------------2/10 (20.0%)
  • Temperature ranges between (+2° C and +8° C) for the fridge for the last two weeks ------ only in one; the other the temperature ranged from – 2° to +6°C; the rest could not be appreciated because no sign was put in front of the figures.
  • Abnormal temperatures are noted with red colour ---------------------1/2 (50.0%)
  • POLIO is in the freezing compartment of the fridge of HC/Health Facility ----- 10/10 (100.0%)
  • DPTHepB; TT; BCG, Measles, YF are in the cooling compartment -----10/10 (100.0%)
  • Ice packs are kept in freezing compartment of the fridge ---------------10/10 (100.0%)
  • Ice packs are well arranged vertically in freezing compartment --------7/10 (70.0%)
  • Fridge is well maintained (not full with ice, and clean) ----------------7/10 (70.0%)
  • Things other than vaccines not found in the refrigerator --------------------9/10 (90.0%)
    Opened vaccine vials BCG/Measles/YF not found in the fridge ---------10/10 (100.0)%
  • Vaccines are scattered in the fridge ---------------------- 2/10 (20.0%)
  • DPTHepB, TT, OPV, are given daily in centres having fridges --------7/9 (77.78%)
  • Quantity of Oral polio vaccine with VVM bad ----------------------0.0%
  • The District Service has a functional deep freezer ----------------------------------1/1 (100.0%)
  • The temperature chart is pasted on the deep freezer ------------------- 0.0%
  • The deep freezer has a thermometer -------------------------------------- 1/1 (100.0)
  • Temperatures are noted twice a day ------------------------------------0.0%
  • Temperature is written with – or + in front of figures ---------------- 0.0%
  • Temperature ranges are between (-15°C to – 25°C) for the deep freezer --- 0.0% (not recorded)
  • POLIO is in the deep freezer at the District Health Service --------------------0.0%
    Ice packs are kept in the deep freezer at the District Health Service ----100.0%
  • Ice packs are placed vertically in the deep freezer at the District Health Service -----0.0%

V. MANAGEMENT OF MATERIALS AND VACCINES
  • There is a register/form for vaccine stock management ---------------------10/11 (90.9%)
  • No shortage of vaccine since last 3 months-----------------------------------11/11 (100.0%)
  • Auto-destruct syringes are in sufficient quantity ---------------------------11/11 (100.0)
  • Kerosene reserve (minimum 5l) ----------------------------------------------2/2 (100.0%)
  • There is a stand by bottle of gas----------------------------------------------2/2 (100.0%)

VI. INJECTION SECURITY
  • All injections of vaccines are done with auto-destruct syringes ------------10/10 (100.0%)
  • No recap of needles is done after use -----------------------------------------11/11 (100.0%)
  • Used syringes/needles are put in safety boxes (puncture proof)---------- 11/11 (100.0%)
  • Used syringes/needles are destroyed by incineration---------------------1/11 (9.1%)
  • Syringes and needles are destroyed by burning before burying ----------6/11 (54.6%)

VII. MONITORING OF VACCINATION COVERAGE
  • The graph for the monitoring of vaccination coverage at HF is used—3/11 (27.27%)
  • The annual objective for the vaccination coverage is indicated ----------2/11 (18.18%)
  • Problems are identified from the graph ------------------------------------1/11 (9.09%)
  • Actions are taken to improve or consolidate the coverage ---------------1/11 (9.1%)
  • Feed back on monitoring graphs from the District Service -------------- 10/10 (100.0%)

VIII. ACUTE FLACCID PARALYSIS (AFP) SURVEILLANCE
  • Consultation registers are reviewed by supervisors ---------------------- 9/11 (81.8%)
  • Consultation registers are reviewed and signed by supervisors ---------6/11 (54.55)
  • Case definitions of diseases under surveillance (AFP, measles, etc) are displayed at health facilities ---5/11 (45.5%)
  • Social mobilisers carry out active search for cases of AFP in the community --- 10/10 (100.0%)
  • Social mobilisers have copies of case definitions of AFP, Yellow fever, measles, etc ----- 0.0%
  • Health staff carries out active search for AFP in the community by ------10/10 (100.0%)

IX. TOOLS USED
  • The current recommended EPI return form is used ----------------------8/11 (%)
  • The current recommended tally sheets are used at vaccination centre ---10/10 (100.0%
  • Health area synthesis are made and attached to the health area return form ---- -0/5 (0.0%)
  • The indicators on monthly EPI return form are correctly calculated ----8/11 (72.7%)
  • Monthly Return per strategy is made --------------------------------------- 10/11 (90.91%)
  • Monthly Stock management Return is made ------------------------------ 8./11 (72.5%)

Detailed results per health facility is presented in the tables of the synthesis of the supervision checklist

DISCUSSION

Most of the activities and tasks of routine EPI are correctly carried out.

Preparation and utilisation of 0.5% chlorine solution for decontamination is not optimum, and recapping of needles is still practiced in some laboratories. Dettol (parachlorometaxylenol) and Salvon (Cetrimide) are used as disinfectants, instead of as antiseptics in some health facilities.

The placenta pits are abandoned old pit latrines. A placenta pit should be of about one metre in diameter and two metres deep, having an airtight concrete slap with a concrete cover. The pit should have a ventilation pipe.

The temperature charts of refrigerators could not be well appreciated because only 2/10 (20%) put – or + in front of the recorded temperature figures.

In November 2005 only 2/7 (28.6%) fridges had ice packs arranged vertically in freezing compartment compared to 7/10 (70.0%) in December 2005 because of the immediate feedback.

In reality only one health facility attempted using the monitoring graph for the monitoring of vaccination coverage rate; but all had feed back on monitoring graphs from the Health District Service

Integrated surveillance of diseases with epidemic potentials needs improvement in the following aspects: reviewing and signing of consultation registers by supervisors, displaying case definitions at health facilities, and providing flyers of case definitions with pictures to social mobilisers.

The performance of each vaccination centre in health areas with many vaccination centres cannot be easily appreciated because health area syntheses from the different vaccination centres are not made and attached to the health area monthly EPI return form.

Although most health areas forward the monthly stock management returns to the District Service, the Health District synthesis is not easily done.

The monthly synthesis of EPI returns at the District Service is done manually; but the form for the compilation of data is very inadequate.

Syringes and needles are put in safety boxes at all vaccination units but at other posts they are disposed of in dustbins in some health facilities. Only one health facility has and uses an incinerator.

Most health facilities have pits, but they are not the recommended models; waste are more often not burnt immediately before putting in the pits.

The filing system at all levels needs great improvement.

Potentials of the Health District:
  • The District Health Service has a complete computer set and a photocopy machine
  • It can be used by the District Chief of Service of Public Health
  • Most members of the District Health Service and Health Centre teams have been trained in the components of the Norms and Standards on EPI

The author had updated the tools of the norms and standards on EPI Cameroon as more information was requested by the Central level, and elaborated intermediate tools to facilitate the compilation and verification of data on routine EPI; and the monitoring of the evolution of vaccination coverage rates used in Bamenda Health District up to August 2005:
  1. Form for the monthly report of activities and surveillance of target diseases of EPI (Norms and standards)
  2. Form for health area summary of EPI returns for the month before filling the health area monthly return form for health area with many vaccinating centres, and out reach posts.
  3. Monitoring of the evolution vaccination coverage rate (EPI norms and standards)
  4. Graph for the monitoring of vaccination activities using the indicators calculated in the monthly EPI return form
  • Recruitment rate: (cumulative BCG/F) x 100
  • Achievement rate: (cumulative Measles/F) x 100
  • Complete coverage rate: (cumulative DPTHepB3/F) x 100
  • Monthly proportion vaccinated (% vaccinated in the month) = (DPTHepB3 in the month/E) x 100


E = Total annual target population / 12
F = Target (0-11m) monthly cumulative population since Jan = (E x number of the month

A computer example of this form is shown in the next Post

  1. Manual synthesis of EPI returns at the Health District Service.
  2. Daily vaccination session report with emphasis on children 0 – 11months, 12 months and above. This tool permits the personnel and supervisors to easily identify each child vaccinated in the register and to ensure that the number of children vaccinated corresponds to that in the tally sheet.
  3. Form for the monitoring of types of EPI returns and dates received at the District Health Service; it permits the appreciation of Completeness and Timeliness
  4. Form for the assessment of vaccination status of vaccination status of children 0-11 months in the community
  5. Form for synthesis of the assessment/monitoring of vaccination status of children 0-11 months in the community. The two above forms are very useful for the monitoring of declared vaccination coverage rates, and for providing facts for social mobilisation activities in that community.
  6. Monthly report of vaccines, vitamin A, and cold chain management (Norms and standards)
  7. Report of monthly vaccination activities by strategies (Norms and standards)
Proximity social mobilisation in the community should be done using flyers of simple vaccination calendars for children and pregnant women. It should also be based on facts that are obtained by the intermittent assessment (every 3, 4, or 6 months) of vaccination status of children 0 – 11 months in the community by social mobilisers and staff of the health area, using the appropriate tools proposed in this write up. By so doing a strong community adhesion to and participation in EPI will be achieved. The results thus obtained will be compared with those declared through the declared routine EPI data.

The manual synthesis of complex data collection forms by the District Health Team is usually very difficult and strenuous, but since many health District Service presently have computers, simple excel computers will greatly help the District Service Team in data processing. The author has developed and used the following programmes in the Bamenda Health District for many years:
  • The programme for the Health District synthesis of the form for the monthly report of activities and surveillance of target disease of EPI
  • The programme for the Health District synthesis of the report of monthly activities by strategy.
  • The programme for the Health District synthesis of monthly report of vaccines, vitamin, and cold chain management.

CONCLUSION

The use of well designed intermediate EPI tools and simple computer excel programmes that permit one to verify routine EPI data reported by the Health District, and the confirmation through formative supervision that these data are exact and the same in all these tools including the National tools render the Health District monthly report authentic.

The production of authentic EPI data in the Health District requires:
  • Commitment of the health staff to produce correct, exact, realistic, and valid data.
  • Willingness and enthusiasm of the health personnel to acquire innovations.
  • Use of intermediate tools for synthesis at the level of health area and Health District Service
  • Use of simple excel computer programmes for Health District syntheses where ever possible
  • Capacity building of District Health Service and Health Facility teams in the Norms and Standards of EPI of Cameroon
  • Supportive/formative supervision of Health Centre and Health District Service teams using appropriate checklists.
  • A good filing and documentation system at all levels; this will facilitate verification of the process and results.

Capacity building of Health Centre and Health District Service teams is primordial and should be continuous, during all appropriate occasions, for a Chief of Health Centre told the author ‘Doctor I did nursing because of it had no mathematics, but now I am involved in a lot of difficult mathematics’

The periodic assessment of the vaccination status of children 0 – 11 months in the community by social mobilisers and staff of the health area is an effective means of monitoring the authenticity of results obtained through declared routine EPI data.

***This write up is a modest contribution towards ensuring the authenticity of routine EPI data declared by Health Districts.***


REFERENCE
I. Mid-Level Management Course for EPI Managers; WHO Regional Office for Africa.

II. Expanded Programme on Immunisation (EPI) in Bamenda health district- Cameroon from 1999 – August 2005 (September 2005); Dr Mfonfu Daniel; website: www. mfonfudaniel.blogspot.com

III. Demographic and health survey 2004, Cameroon; Vaccination coverage rate in children 12-23 months

IV. Normes et Standards du Programme Elargi de Vaccination (PEV), Cameroun, Ministère de la Santé Publique, Janvier 2005

V. Infection Prevention for Family Planning Service Programs; JHPIEGO; Lind Tietjen, Wendy Cronin, Noel McIntosh:
***View related tables and graphs on next Post****